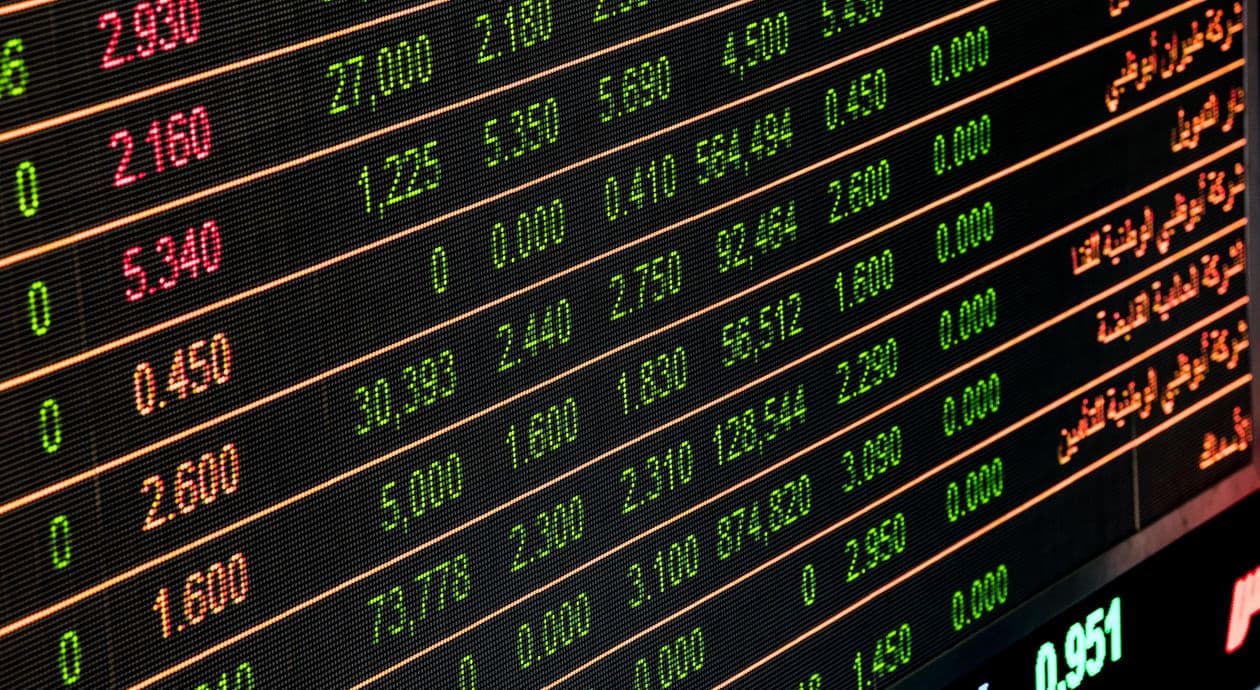
What happened
The S&P 500 fell 0.38 percent on Friday 4 September, the Dow Jones Industrial Average lost 0.51 percent and the Nasdaq Composite slipped 0.29 percent, reversing a strong run earlier in the week. The trigger was the August jobs report, which showed the US adding 162,000 roles against expectations of 53,000, and prompted an immediate move higher in government bond yields.
The week had started very differently. On Wednesday the S&P 500 advanced 0.46 percent to 7,666.60 and the Nasdaq gained 0.45 percent to 26,217.83, both helped by a pause in a bond selloff that had driven Treasury yields to multiyear highs. On Thursday the Dow rose 1.2 percent, or 624 points, to 53,686.11 and the Nasdaq added 1.4 percent to 26,584.06, after dovish comments from Federal Reserve officials pulled the 10-year yield down to 4.77 percent from 4.818 percent.
Fridays data undid much of that. A bond yield is the annual return an investor earns by holding a government bond to maturity, and it rises when bond prices fall. Strong employment data means fewer expected rate cuts, which makes existing bonds paying today rates less attractive, so their prices fall and yields rise.
Individual stocks provided their own drama. Campbells fell almost 7 percent after guiding to fiscal 2027 earnings of 1.65 to 1.80 dollars a share against a consensus of 1.83 dollars, while Ultragenyx Pharmaceutical plunged more than 46 percent after a Phase 3 trial missed its primary endpoint.
Why it matters
The 10-year US Treasury yield is often described as the most important number in finance, and the description is fair. It is the risk-free benchmark against which every other investment on the planet is measured. Mortgage rates, corporate borrowing costs, private equity deal maths and the valuation of every technology stock all sit on top of it.
When that yield moves from 4.3 percent to nearly 4.9 percent, as it has over recent months, the arithmetic of investing changes. A company whose profits arrive mostly in the distant future is worth less today, because those future profits are discounted back at a higher rate. That is why fast-growing technology shares tend to fall hardest on days when yields spike, even when nothing has changed about the businesses themselves.
It also changes the competition for savings. For most of the 2010s, government bonds paid almost nothing, and investors were pushed into shares because there was no alternative. At close to 5 percent, US Treasuries and UK gilts offer a real return above inflation with government backing. Money that had nowhere else to go now has somewhere to go.
For UK investors, the read-across is direct. Gilt yields track Treasuries closely, and gilt yields set the discount rate used by defined benefit pension schemes to value their liabilities. Higher yields have quietly improved the funding position of many UK schemes over the past two years.
Explained simply
A rising bond yield is gravity being turned up. Everything still flies, but everything has to work harder to stay in the air, and the highest-flying things feel it first.
Imagine you are offered two things: a share in a young company that might pay you a lot in ten years, and a government bond that pays you 5 percent a year guaranteed. When the bond paid 1 percent, the share looked compelling almost regardless of how uncertain it was. At 5 percent, you need much more convincing.
Professional investors formalise this with a discount rate. To value a company, they estimate the cash it will generate every year into the future and then shrink each of those future amounts to reflect the fact that money later is worth less than money now. The government bond yield is the starting point for how much they shrink it by.
Raise that yield and the shrinking becomes more aggressive, especially for cash flows far in the future. A profit expected in year one barely changes. A profit expected in year fifteen loses a large chunk of its present value. That is the whole reason the Nasdaq is more sensitive to yields than the Dow.
The knock-on is that yield moves can shake markets without any bad economic news at all. Fridays selloff came on the back of unambiguously good news about American employment. The market was not saying the economy is weak. It was saying the price of money just went up.
What it means for you
If you have a workplace pension in a default lifestyle fund, higher yields have probably helped you more than hurt you. Those funds shift towards bonds as you approach retirement, and bonds bought today lock in yields that were unavailable for a decade. If you are within ten years of retirement, this is a materially better environment than 2021.
If you are choosing where to hold cash you will need in one to three years, gilts and short-dated bond funds now merit a look alongside Cash ISAs. A gilt yielding around 4.5 percent held to maturity gives a known return, and for higher-rate taxpayers gilts have a specific advantage: capital gains on gilts are exempt from UK capital gains tax, so low-coupon gilts bought below par can be more tax-efficient than a savings account.
If you hold a global tracker such as one following the MSCI World or FTSE Global All Cap, roughly two thirds of it is US shares and a meaningful slice is a handful of very large technology companies. That means your fund is more sensitive to Treasury yields than the word global suggests. This is not a reason to sell, but it is worth knowing why your portfolio moves on days when a US employment number surprises.
If you were planning to add to markets, days like Friday are the ordinary texture of investing rather than a signal. A 0.38 percent daily move in the S&P 500 is entirely unremarkable; the index has had dozens of larger moves this year alone.
The bigger picture
September has a genuinely poor historical record. It is the only month in which the S&P 500 has finished lower more often than higher since 1928, closing down in 55 percent of years with an average return of minus 1.1 percent. Seasonality is a weak signal and no basis for a strategy, but it does explain why sentiment is jumpy.
The more substantive question is whether yields have peaked. The bond selloff of recent months has been driven by heavy government borrowing, persistent inflation from energy, and the unwinding of expectations for rapid rate cuts. Two of those three are still in force. Watch the US inflation release later in September and the Federal Reserve meeting that follows: a soft inflation print would pull yields down quickly and would likely be the single most supportive thing that could happen to global equities this autumn.


